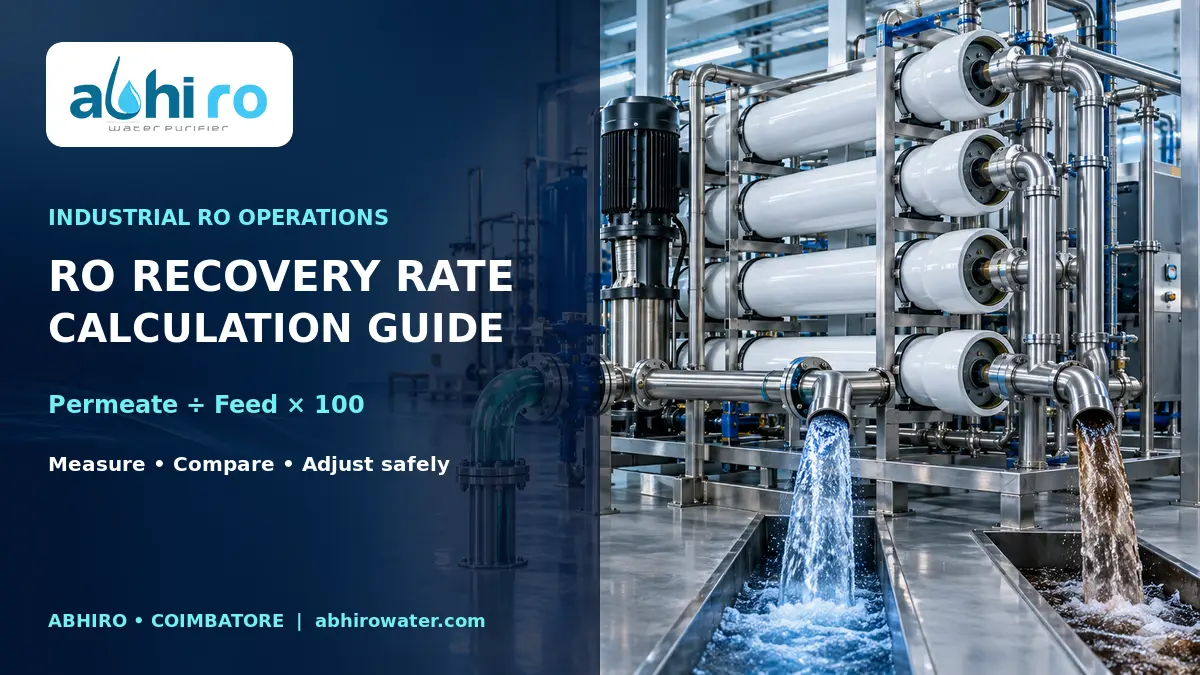
Industrial RO recovery rate is the percentage of feed water converted into permeate. Calculate it by dividing permeate flow by feed flow and multiplying by 100. A higher recovery is not automatically better: exceeding the design limit can increase scaling, pressure and membrane fouling. Use measured flows, water analysis and the membrane system’s design values before making adjustments.
What You Will Learn
- What industrial RO recovery rate means
- How to calculate RO recovery rate
- Why recovery rate changes
- How to improve low recovery safely
- Warning signs of excessive recovery
- What to record in an operating log
- Frequently asked questions
What Industrial RO Recovery Rate Means
Recovery rate shows how the incoming feed flow divides between useful permeate and concentrated reject water. If a plant receives 1,000 litres per hour of feed and produces 600 litres per hour of permeate, its recovery is 60%. The remaining flow normally leaves as concentrate, apart from small measurement differences or other designed losses.
Recovery is not the same as salt rejection. Recovery compares water flows, while salt rejection describes how effectively the membrane reduces dissolved salts. A plant can show its expected recovery but still produce poor-quality permeate if a membrane, seal or instrument has a problem.
The safe target depends on feed-water chemistry, temperature, membrane arrangement, pretreatment and the original design. Borewell water in Coimbatore may have a different scaling tendency from municipal or processed water, so one universal recovery setting cannot suit every site.
How to Calculate RO Recovery Rate
Use stable, simultaneous flow readings rather than combining values taken under different operating conditions.
Recovery (%) = Permeate flow ÷ Feed flow × 100
You can cross-check the feed reading with:
Feed flow ≈ Permeate flow + Reject flow
Step-by-step calculation
- Allow the RO plant to reach steady operating conditions.
- Record the feed, permeate and reject flows in the same unit, such as LPH.
- Confirm that permeate plus reject flow is reasonably close to feed flow.
- Divide permeate flow by feed flow.
- Multiply the result by 100.
- Compare it with the commissioned or design recovery—not with an arbitrary target.
Example: a plant has 2,000 LPH feed, 1,200 LPH permeate and 800 LPH reject. Recovery is 1,200 ÷ 2,000 × 100 = 60%.
If no feed flowmeter is installed, recovery can be estimated as permeate flow ÷ (permeate flow + reject flow) × 100. A calibrated feed meter is preferable because it makes the mass-balance check possible.
Why Recovery Rate Changes
A change in recovery is evidence to investigate, not immediate proof that the reject valve needs adjustment. Common causes include:
- changed feed pressure or pump performance;
- seasonal feed-water temperature changes;
- fouled cartridge filters or inadequate pretreatment;
- membrane scaling, organic fouling or biofouling;
- a drifting, blocked or incorrectly read flowmeter;
- changed backpressure on the permeate line;
- reject-valve movement or obstruction; and
- ageing membranes or damaged seals.
Compare readings only under similar feed temperature, pressure and water quality. For a better diagnosis, examine recovery together with permeate conductivity, differential pressure and normalized permeate flow. ABHIRO’s guide to cartridge versus bag filter housings explains how upstream solids loading can affect filtration and downstream equipment.
How to Improve Low Recovery Safely
Improve recovery by finding the cause and restoring the designed operating condition. Simply restricting reject flow can concentrate salts beyond the plant’s safe limit.
- Validate the instruments. Check flowmeters, pressure gauges, conductivity meters and sampling points.
- Review the operating log. Identify when the change began and what else changed at the same time.
- Inspect pretreatment. Check cartridge-filter differential pressure, media-filter operation, softener performance and chemical dosing where applicable.
- Check feed-water chemistry. Hardness, alkalinity, silica and other scale-forming constituents influence allowable recovery.
- Compare normalized performance. Temperature and pressure affect membrane output, so raw flow alone can be misleading.
- Follow the approved cleaning procedure. Clean membranes only when performance indicators and the membrane supplier’s guidance support it.
- Return settings gradually. Adjust only within the system designer’s or membrane manufacturer’s limits while monitoring pressure, flow and permeate quality.
For replacement cartridges, housings and other pretreatment components, see ABHIRO’s industrial water-purifier products.
Warning Signs of Excessive Recovery
Excessive recovery reduces reject flow and raises the concentration of dissolved salts inside the membrane system. Warning signs may include:
- a recovery value above the commissioned target;
- rapidly increasing differential pressure;
- declining permeate flow or quality;
- frequent membrane-cleaning requirements;
- scale deposits in housings or reject piping; and
- unstable pressure after reject-valve adjustment.
Do not close the reject valve to chase maximum permeate production. Adequate concentrate flow is essential for carrying concentrated salts away from the membrane surface.
What to Record in an Operating Log
A useful log makes gradual deterioration visible before it becomes a breakdown. Record these values at a consistent time and operating condition:
- feed, permeate and reject flow;
- feed, interstage and reject pressure where instruments are installed;
- cartridge-filter and membrane differential pressure;
- feed and permeate conductivity or TDS;
- feed-water temperature and pH;
- calculated recovery and salt rejection;
- dosing-pump setting and chemical batch details; and
- cleaning, cartridge changes and unusual events.
Trends matter more than isolated readings. Investigate a consistent deviation instead of reacting to one uncertain measurement.
Frequently Asked Questions
What is a good recovery rate for an industrial RO plant?
There is no single correct percentage. The suitable rate depends on the feed-water analysis, membrane array, pretreatment and plant design. Use the commissioned target and current water chemistry.
Does higher RO recovery always reduce operating cost?
Not necessarily. It may reduce reject volume, but excessive recovery can increase scaling, cleaning frequency, energy use and membrane replacement cost.
Why does recovery fall when the weather becomes colder?
Lower water temperature reduces membrane water permeability. Permeate flow may fall even when the membrane is not fouled, which is why normalized performance is useful.
Can I calculate recovery without a feed flowmeter?
Yes, estimate feed flow by adding permeate and reject flows. However, a reliable feed flowmeter enables a useful mass-balance check and may improve troubleshooting.
Should I adjust the reject valve if recovery is low?
Only after confirming instruments, pretreatment, water chemistry and design limits. An incorrect adjustment can cause scaling or inadequate concentrate flow.
Get Industrial RO Performance Support in Coimbatore
ABHIRO Water Purifier supplies industrial RO systems, membranes, filter housings, cartridges, meters, pumps and dosing components. Share your feed-water analysis, design capacity and current pressure, flow and conductivity readings with our team for practical troubleshooting support. Contact ABHIRO or call +91 99430 99998.
Explore more practical guides in the ABHIRO Water Treatment Knowledge Centre, covering industrial RO systems, membranes, water testing, maintenance, treatment chemicals and water-treatment components.
Feed, permeate and reject flow relationships
For a steady RO system, the basic water balance is:
Feed flow = permeate flow + reject (concentrate) flow.
If recovery is known:
- Permeate flow = feed flow × recovery fraction.
- Reject flow = feed flow − permeate flow.
- Feed flow = permeate flow ÷ recovery fraction.
Example: if a plant produces 1,000 L/h permeate at 50% recovery, feed flow is approximately 2,000 L/h and reject flow is approximately 1,000 L/h. These are hydraulic relationships; the chosen recovery must still be safe for the feed-water chemistry, membrane array and scaling limits.